
Tech Tips: Ben Schorr explains how legal teams can use Microsoft 365 Copilot to find the story inside lists spreadsheets, and document libraries.
The post Create Interactive Dashboards With Microsoft Copilot appeared first on Articles, Tips and Tech for Law Firms and Lawyers.
Here’s how legal teams can use Microsoft 365 Copilot to build interactive law firm dashboards that help find the story inside lists, spreadsheets and document libraries.

Highlights
- Turn Static Data into Actionable Insights: Learn how using Microsoft Copilot for law firm dashboards turns raw SharePoint lists and scattered Excel workbooks into interactive visual summaries.
- Eliminate Manual Spreadsheet Cleanup: Skip hours of copying, pasting, and building pivot tables to visualize monthly receivables, intake queues and deadline tracking.
- Data Hygiene and Permissions Matter: Ensure clean column headers, consistent metadata and proper Microsoft 365 access controls before generating dashboards.
When I was in business school, when dinosaurs still roamed the earth, the principal problem we talked about was how to get more data and how to turn that data into information. Today, we have the opposite problem. We’re drowning in data, and it’s a constant battle to whittle down the information racing at us to just the actionable stuff.
A SharePoint list might track new client intake requests, litigation deadlines, equipment assignments, training attendance or marketing opportunities. A SharePoint document library might hold monthly AR aging reports, billing exports or operations spreadsheets. Those sources are useful, but only if someone has the time and skill to turn them into charts, filters, summaries and trends.
That is where Copilot in SharePoint is starting to get more interesting. With a Microsoft 365 Copilot license, Copilot can help you work with content already stored in SharePoint, including lists, libraries and files, and use natural language to create interactive reports and dashboards.
Two Common SharePoint Data Sources for Dashboards
When we talk about SharePoint data for dashboards, we are usually talking about one of two things.
SharePoint Lists
A SharePoint list is structured data that lives directly in SharePoint. Think of it like a lightweight database or spreadsheet. Each row is an item, and each column captures a specific field, such as client name, matter number, deadline, amount or practice area. Lists are often used for intake tracking, task tracking, asset management and workflow queues.
Files Stored in a SharePoint library
A document library is where firms commonly store Excel workbooks, Word documents, PDFs and other files. For dashboards, Excel files are especially important. Many firms already generate monthly reports from accounting, billing, practice management, or case management systems and save them to SharePoint. Copilot can help summarize and visualize what is in those files without requiring someone to manually copy the data into a separate dashboard tool first.
Why This Matters for Law Firms
Dashboards are not just pretty charts. A good dashboard answers practical management questions quickly.
- Which clients have outstanding receivables over 90 days?
- Which practice groups are opening the most new matters?
- Which trainings have been completed, and who still needs to attend?
Historically, answering those questions often meant exporting data, cleaning it up, building formulas, creating pivot tables, formatting charts — and then doing it all again next month. Copilot doesn’t eliminate the need to understand your data, but it can significantly reduce the friction between “we have the information somewhere” and “we can see what is happening.”
Example 1: A Dashboard from a SharePoint List
Imagine your firm uses a SharePoint list to track new client intake. The list includes the prospective client name, practice area, referral source, intake date, assigned attorney, conflict-check status, and current stage. Instead of manually building a report, you could ask Copilot something like:
Create an interactive dashboard from this intake list. Include total new intakes by month, intakes by practice area, referral sources, average days from intake to conflict check, and a table of items still waiting for review. Add filters for practice area, responsible attorney, and intake stage.
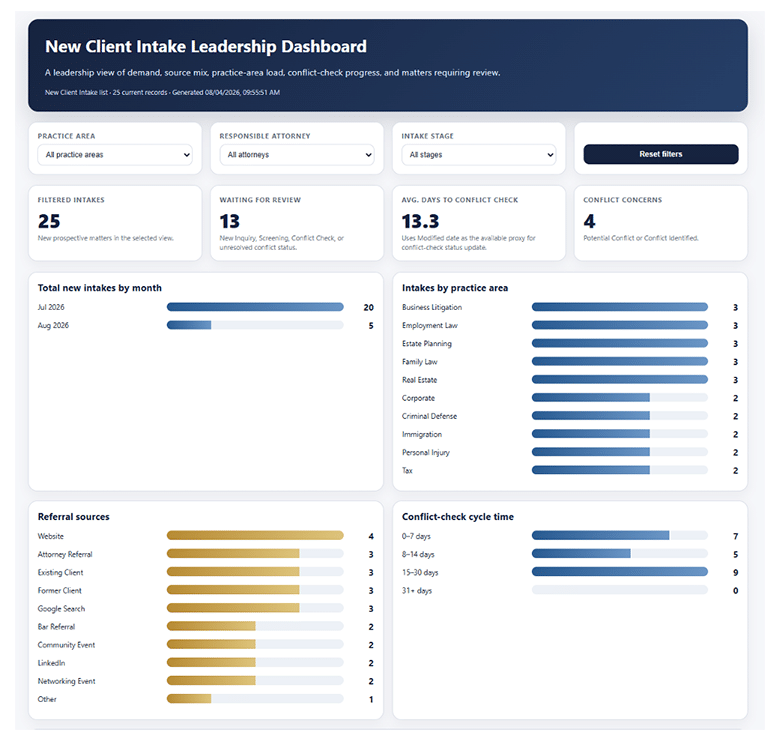
This kind of dashboard can help a managing partner see whether intake volume is increasing, which practice areas are growing, where referrals are coming from, and whether opportunities are getting stuck in the process.
The same pattern works for many SharePoint lists: contract review queues, CLE attendance, equipment inventory, policy acknowledgments or pro bono matters. The key is to be specific about the business questions you want answered.
Example 2: A Dashboard from Excel Files in a SharePoint Library
Now imagine your accounting team saves monthly accounts receivable aging reports as Excel workbooks in a SharePoint document library. January.xlsx, February.xlsx, March.xlsx and so on. Each workbook includes client, matter, responsible attorney, total balance, and aging buckets such as current, 30 days, 60 days, 90 days and 120-plus days.
You might ask Copilot:
Create an interactive dashboard based on the Excel files in this folder. Show total receivables by month, receivables over 90 days, top 10 clients by outstanding balance, and balances by responsible attorney. Include trend lines from January through July and add filters for attorney and aging category. Include a short executive summary explaining what changed over time.
For a firm administrator, this is much more useful than opening seven separate spreadsheets and trying to remember which numbers changed. Copilot can help turn a folder full of monthly reports into a clearer management view: what is improving, what is worsening, and where someone should follow up.
Good Dashboards Start With Good Data
Copilot can help you analyze and present information, but it cannot magically fix every data problem. If your list has unclear column names, inconsistent matter numbers, missing dates, duplicate entries, or 10 different spellings of the same attorney’s name, the dashboard may reflect that confusion.
Before asking Copilot for a dashboard, check the basics:
- Use clear column names.
- Keep dates in date columns, not typed into notes fields.
- Use consistent names for attorneys, clients, departments and practice groups.
- Make sure the people who will use the dashboard have permission to see the underlying data.
This is especially important in law firms because dashboards can easily expose sensitive client, matter, financial or personnel information. Copilot respects Microsoft 365 permissions, but that does not mean every dashboard should be broadly shared. If the dashboard is based on data only the finance team should see, keep it in a location with properly limited access.
Sample Prompts to Try
Here are a few practical starting points you can adapt for your own SharePoint lists and libraries.
- Create a dashboard from this matter status list showing matters by stage, responsible attorney, next deadline, and items overdue by more than seven days.
- Analyze the Excel files in this folder and create a monthly trend dashboard showing total billings, collections, and receivables over 90 days.
- Create an interactive report from this training attendance list. Show completion by office, department and role. Include a table of people who have not completed the required training.
- Summarize this document library and create a dashboard showing file counts by matter, recently modified files, stale files older than two years, and files missing required metadata.
Bottom Line on Using Copilot for Law Firm Dashboards
Interactive dashboards used to require someone with reporting experience, enough Excel skill to survive pivot tables, or access to a more formal business intelligence tool. Those tools still matter, especially for complex reporting. But for many everyday management questions, Copilot in SharePoint may offer a faster path from stored information to useful insight.
Copilot for Law Firm Dashboards FAQ
About Affinity Consulting Group
Affinity Consulting Group inspires, enables and empowers legal teams of all sizes to work smarter, from anywhere. The company’s holistic approach incorporates people, process and technology. Affinity’s passionate, well-connected industry experts work hand in hand with you to help you better understand and optimize your business — from software to growth strategy, and everything in between.
More Microsoft Tips for Lawyers
- Build Your Own Copilot Legal Assistant — No Tech Skills Required
- Microsoft Bookings for Lawyers: Make a Date With Personal Booking Pages
- 6 Ways Microsoft Word Speech-to-Text AI Can Help You Write Faster and Better
- How to Master Page Numbers in MS Word
- How to Master Paragraph Numbering in Word for Multilevel Lists on Mac
Featured Photo by Christina @ wocintechchat.com M on Unsplash.